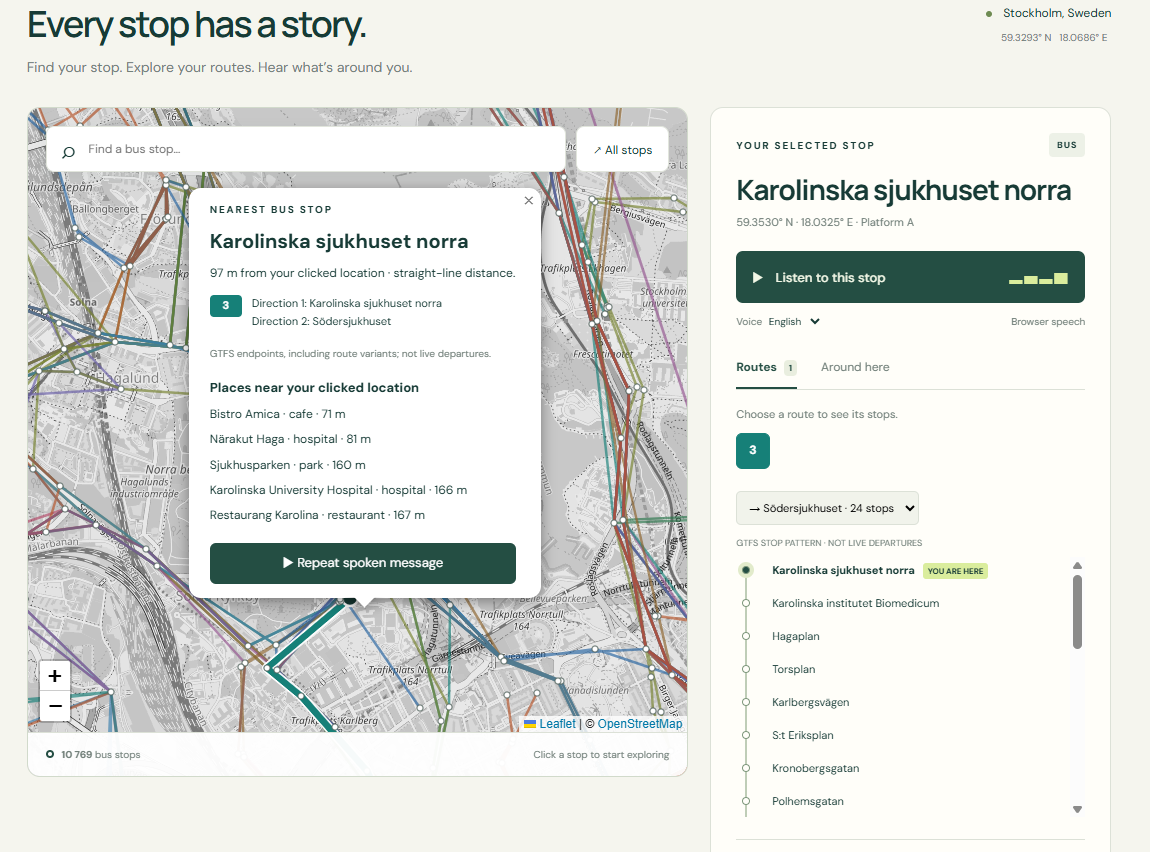
Watch the video on YouTube to see what I’ve built, or keep reading below for the story behind the POC and the problem it explores.
Standing at a bus stop should be a straightforward experience. But arriving somewhere unfamiliar can leave you with several questions at once: Is this the right stop? Which direction does the bus travel? Where does the route end? What is nearby?
The answers may be available, but they are often spread across a map, a timetable, a route diagram and a separate search. Finding the information is one task. Connecting it to where you are is another.
I built a proof of concept (POC) using Stockholm public transport data, to explore whether those answers could be brought together and made available through both visual information and speech.
Starting with a place, rather than a search
Most journey planners start by asking where you want to go. For this experiment, I wanted to start with a different question:
What do I need to know about where I am?
That might mean selecting a bus stop on a map. It might mean clicking somewhere unfamiliar and finding the nearest stop. Or it might mean scanning a QR code at a stop to open information about that specific location.
From there, the prototype connects the place to its transport context: the routes that serve it, their destinations in both directions, and the stops along the way.
It also looks beyond the bus network. Nearby cafés, parks, hospitals and other points of interest help describe the surrounding area. A stop becomes more than a name on a route—it becomes a useful starting point for understanding a place.
Bringing layers of data together
The POC combines two main sources of information.
GTFS data provides the public transport structure: bus stops, routes, trips and ordered stop sequences. OpenStreetMap, accessed through Overpass, adds information about nearby places.
Each layer answers a different question. Transport data tells us how a place connects to the network. Local place data helps explain what is around it.
The value of the POC is in bringing those layers into one interaction. Click on the map, and it finds the nearest boarding point, calculates its straight-line distance and compass direction, and presents route destinations and nearby places together.
That information can then be read aloud at the press of a button.
Why speech matters
Accessibility was one of the reasons I wanted to explore this idea.
A visual map can communicate a lot, but it also asks the user to interpret symbols, trace lines and relate labels to physical locations. A route diagram offers another way to understand the same network. Speech provides another way to receive the information.
Rather than assuming one presentation works for everyone, I wanted to offer several ways into the same content:
- A map for exploring the wider network
- An ordered route diagram for following a sequence of stops
- Written information about the selected location
- Spoken descriptions that can be played and repeated
- A QR link that opens a specific stop directly
This does not make the prototype a finished accessibility solution. That would require testing with people with different access needs, devices and ways of travelling. But it gives me something concrete to test: whether combining these formats makes the information easier to find and understand.
Building on earlier experiments
The POC grew out of two earlier projects.
One explored how timetable and route data could be turned into readable transport diagrams and information panels. The other explored how OpenStreetMap features could become spoken descriptions of a place.
I wanted to bring those ideas together. Could structured transport information and local geographic context support a useful spoken introduction to a bus stop?
A POC felt like the right way to investigate. It lets me test the interaction with real Stockholm data, see where the assumptions break down, and learn what would need to improve before taking the idea further.
Even something as simple as “the nearest stop” raises useful questions. A named stop may have several boarding points. Opposite directions may use different sides of a road. Source data may place two records at identical coordinates. Those details matter when information is intended to help someone understand their surroundings.
What this version does, and what comes next
The current prototype uses planned GTFS route patterns. It does not yet show live departures or guarantee that a particular service is operating today. Distances are measured in a straight line, rather than along a walking route.
Those are meaningful limits. Knowing that a stop is nearby is different from knowing how to reach it safely.
Future work could explore live departures, walking connections, clearer boarding-point information and testing with users. Just as importantly, it could help establish which details people actually want to hear—and how much information is useful in a single spoken message.
For now, this POC is an experiment in making existing data more useful at the point where someone needs it.
The information already exists in separate layers. I built this POC to explore what happens when those layers are connected around a place, a question and a simple way to listen.