
The blur is the signal
For years, satellite imagery has fundamentally changed how we understand the world. What was once available only to intelligence agencies is now accessible to anyone with an internet connection. Commercial services such as Google Maps, Bing Maps and Yandex Maps provide global coverage at resolutions that would have seemed extraordinary just a few decades ago.
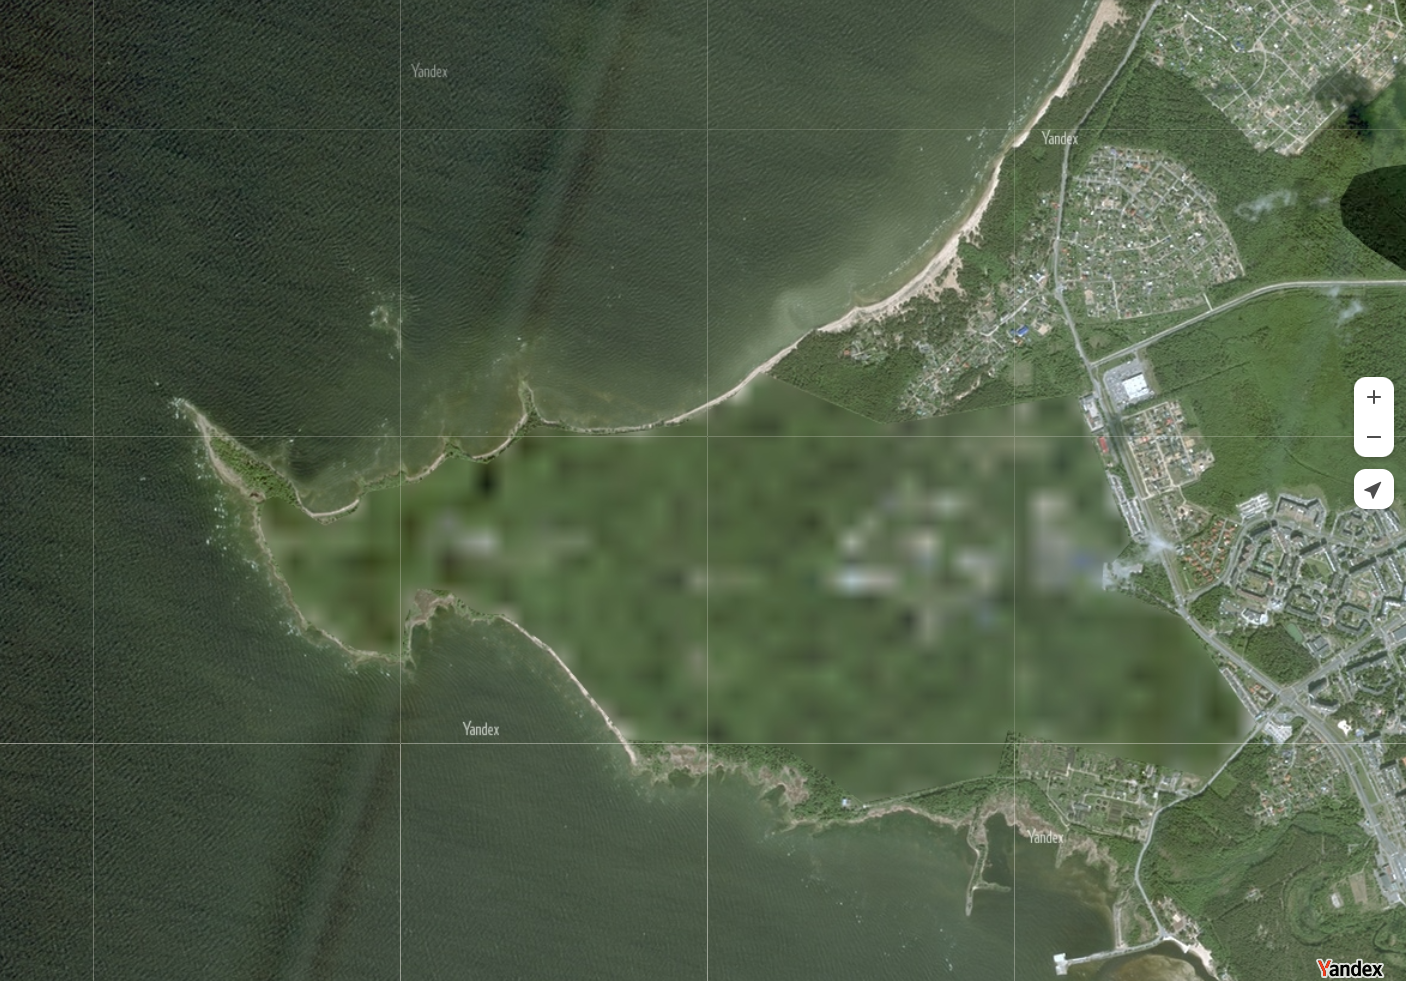
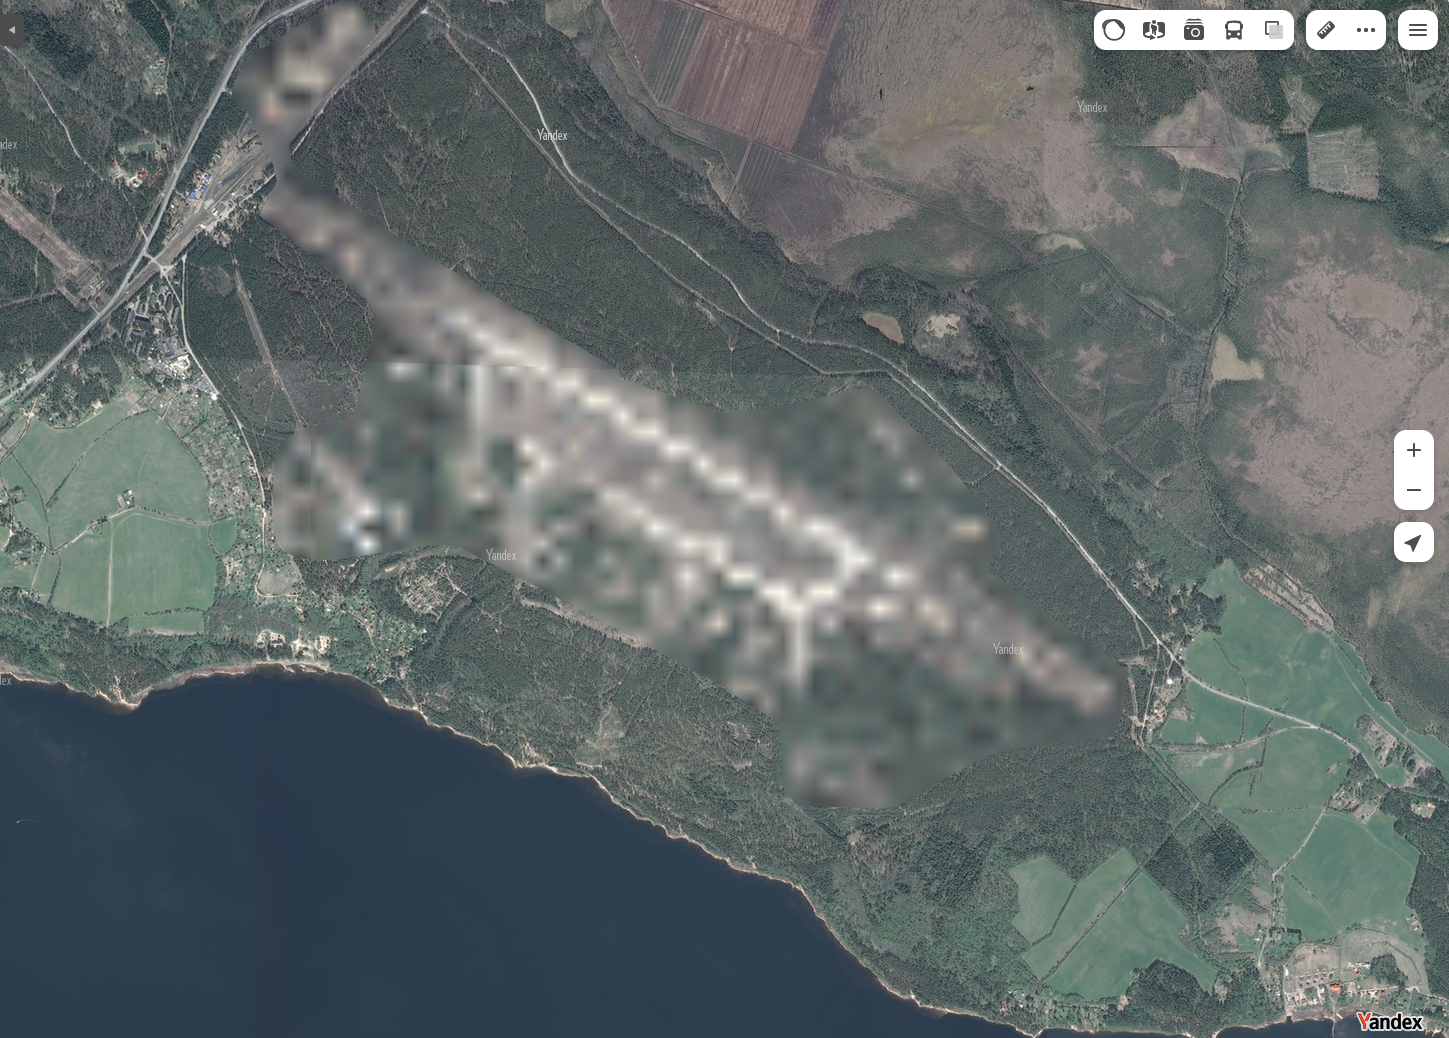
This openness creates a challenge for nations that would rather keep certain activities hidden. One approach occasionally seen is the deliberate blurring of military installations. Russia is perhaps the most well-known example, with a number of military facilities appearing noticeably blurred on Yandex Maps compared to their surroundings.
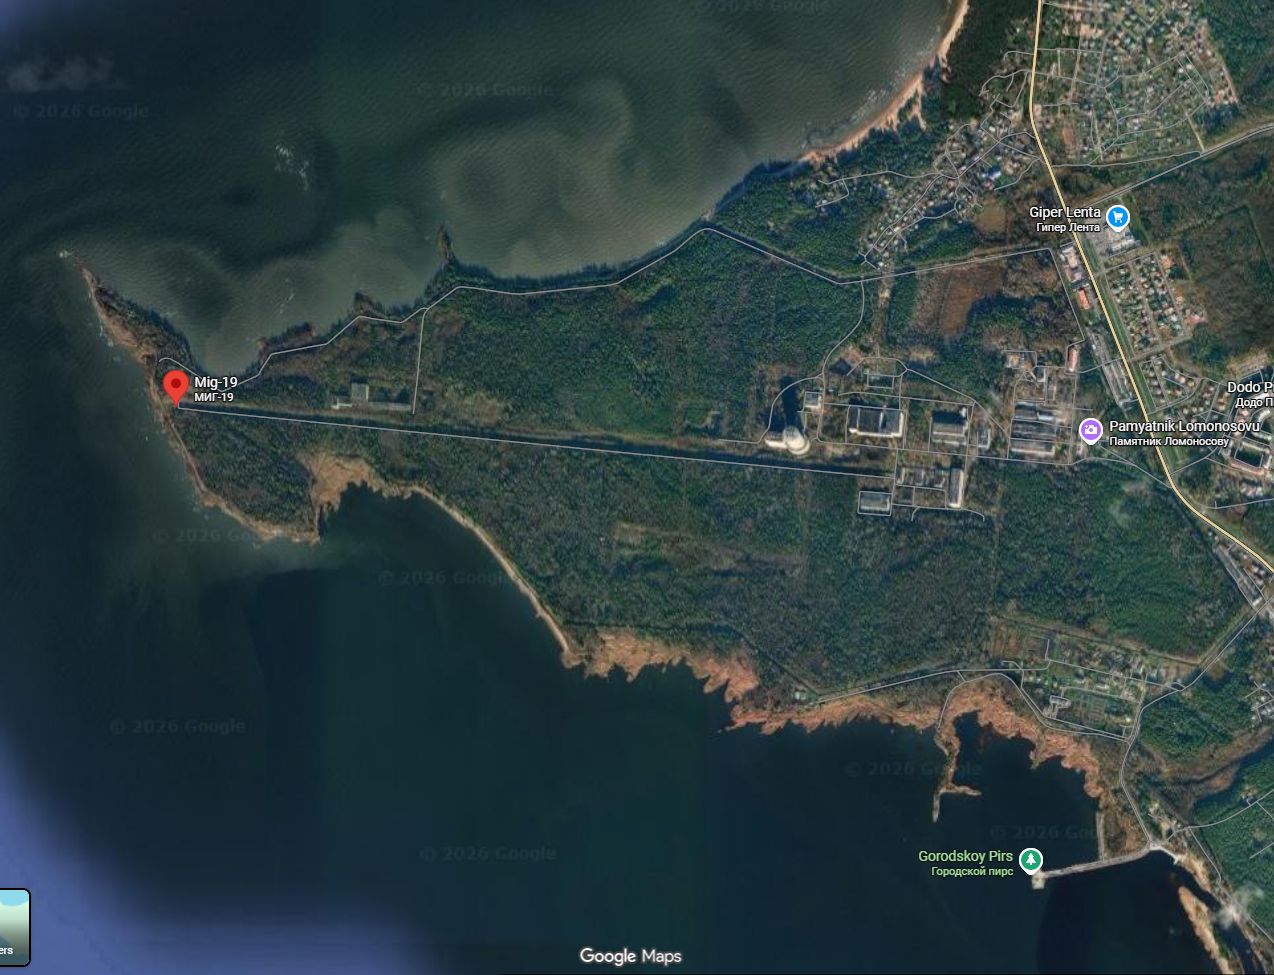
At first glance, the rationale seems obvious. If potential adversaries cannot see the details of a facility, it becomes harder to identify specific buildings, infrastructure, defensive positions or other features that could be used for targeting. Even if the location itself is known, denying access to fine-grained imagery might provide some level of protection.
Whether this is an effective strategy is another question entirely. In a world where multiple commercial imagery providers exist, along with openly available satellite data and countless other sources of information, simply blurring a location on a single mapping platform can appear somewhat naïve. Yet it would be a mistake to underestimate the reasoning behind such measures. Perhaps the blurred installations are exactly the sites observers are expected to find, while more important activities remain hidden in plain sight. Deception has always been a part of military strategy, and visible secrecy can sometimes be as useful as secrecy itself.
Regardless of the motivation, the existence of these blurred regions raised an interesting technical question:
Can we automatically identify areas that appear to have been intentionally blurred?
That question became the starting point for a small OSINT-focused project I’ve spent some time looking into.
Detecting blur at scale
I built a solution that takes a set of geographic locations and automatically fetches imagery for each site. Rather than relying on human inspection, the imagery is analyzed programmatically to determine whether it exhibits characteristics commonly associated with deliberate blurring.
The goal is not to identify military installations directly. Instead, the system looks for signs that imagery has been artificially obscured.
For each location, the software calculates several image-quality metrics and produces a confidence score indicating how likely it is that the area has been blurred.
This allows hundreds or even thousands of locations to be processed consistently and repeatably.
Instead of asking:
“Is this military installation?”
the system asks:
“Does this imagery look unusually blurred compared to what we would normally expect?”
That distinction is important. The software identifies anomalies in imagery quality. Determining why those anomalies exist remains an analytical task for a human investigator.

Measuring information with entropy
One of the simplest metrics used is entropy. In image analysis, entropy is a measure of how much information or variation exists in an image.
Imagine two pictures:
- A picture of a parking lot covered by a uniform gray blur.
- A picture of a city center with roads, trees, buildings and vehicles.
The city image contains much more visual information. Pixel values vary considerably across the image. The blurred parking lot contains far less variation. Entropy attempts to quantify this difference.
High entropy generally means:
- More detail
- More texture
- More variation
- More information
Low entropy generally means:
- Large uniform areas
- Less detail
- Less texture
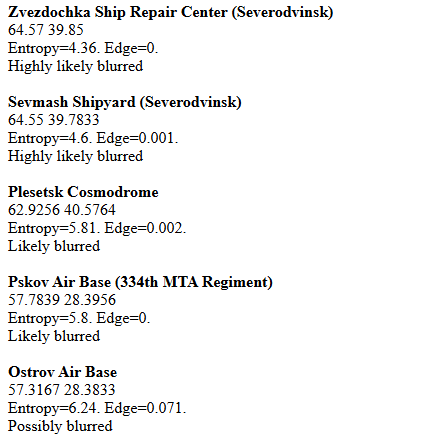
When a military facility is heavily blurred, entropy often drops because many of the visual details are replaced by uniform smeared regions.
If a normal satellite image might produce an entropy value around 6–8, a deliberately blurred image may score significantly lower.
Looking for structure with edge density
The second key metric is edge density. Edges are the boundaries between different objects within an image. Roads, buildings, fences and vehicles all create edges. If you’ve ever adjusted the sharpness of a photograph, you’ve effectively enhanced its edges.
A sharp image contains many visible boundaries and therefore many detectable edges.
A blurred image softens those boundaries. Distinct shapes begin to blend together.
Edge density measures how much of an image contains these detectable structures.
High edge density suggests:
- Buildings are clearly visible
- Roads are well defined
- Objects remain distinguishable
Low edge density suggests:
- Details are smeared
- Boundaries are softened
- Fine structures have disappeared
In many cases, edge density is an even stronger indicator of blur than entropy because intentional image smoothing typically removes edges very effectively.
Turning metrics into a confidence score
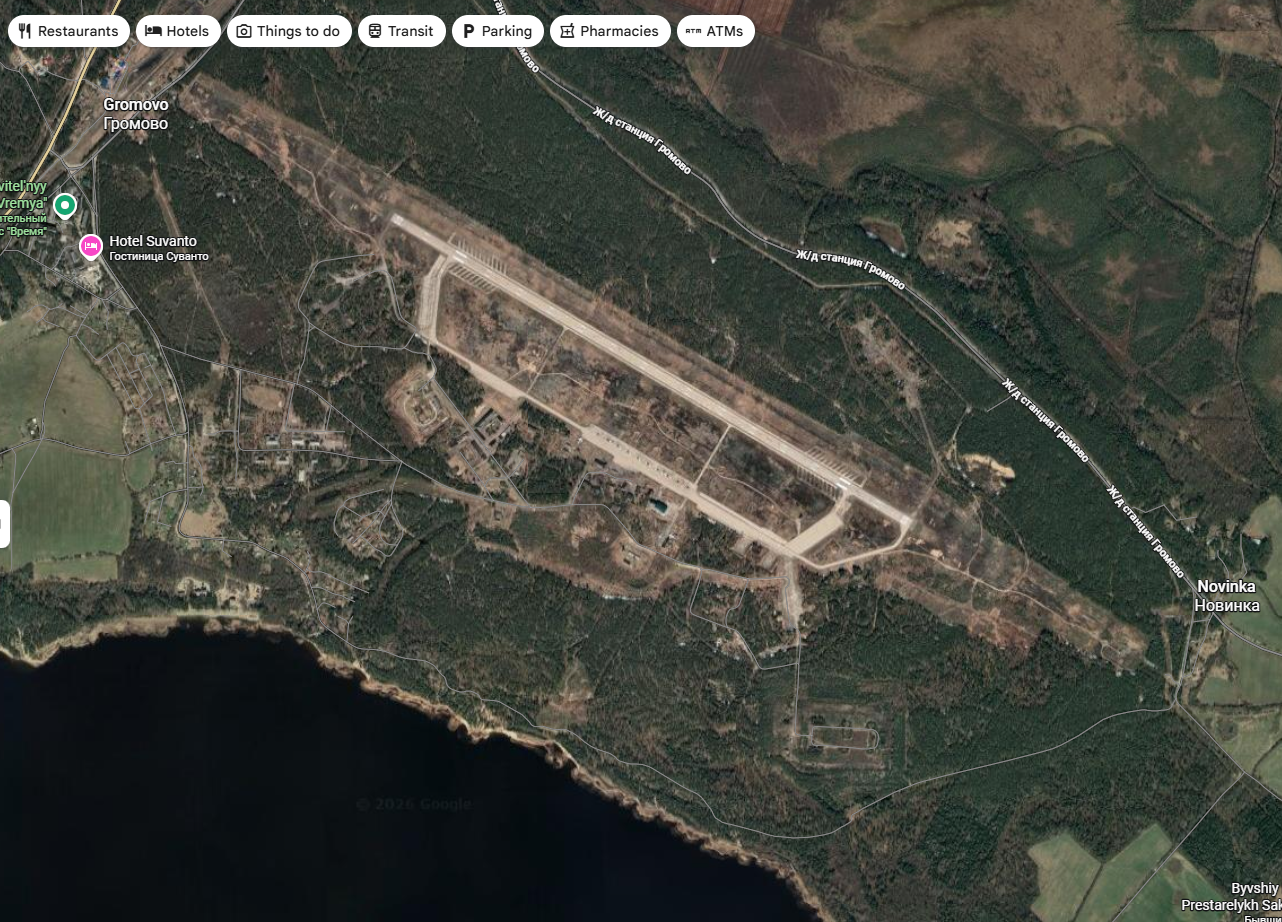
Neither entropy nor edge density alone tells the full story. A snowy field, a desert or an open body of water may naturally have low entropy despite not being blurred. Similarly, some industrial areas have fewer visible edges than dense urban environments.
To reduce false detections, the system combines both measurements into a single confidence score.
Conceptually, the process is simple:
- Lower entropy increases blur confidence.
- Lower edge density increases blur confidence.
- The two values are weighted and combined.
- The result is expressed as a percentage likelihood.
For example:
| Entropy | Edge Density | Blur Confidence |
|---|---|---|
| 6.68 | 0.281 | Very Low |
| 5.80 | 0.120 | Moderate |
| 5.00 | 0.080 | High |
| 4.50 | 0.050 | Very High |
The final output is therefore more meaningful than a simple TRUE/FALSE result. Analysts can immediately see not only whether an area appears suspicious, but also how strongly the imagery differs from expected conditions.
Understanding false positives
No automated detection system is perfect. Several situations can produce imagery that resembles intentional blurring:
- Snow-covered landscapes
- Dense cloud cover
- Water surfaces
- Deserts and barren terrain
- Large uniform industrial complexes
- Low-resolution source imagery
These situations may reduce entropy or edge density despite containing no deliberate obfuscation. This is why the confidence score should be viewed as a prioritization tool rather than a definitive answer.
The software helps direct attention toward locations worth investigating further. Human judgment and contextual information remain essential.
Future enhancements and operational applications
While the current solution demonstrates that intentionally blurred imagery can often be detected automatically, it should be viewed as a starting point rather than a finished capability. There are several natural extensions that could improve both detection accuracy and operational value.
Strengthening blur detection with additional image analytics
One obvious enhancement is the introduction of additional image quality metrics such as Variance of Laplacian. Unlike entropy and edge density, which measure overall information content and structural detail, Variance of Laplacian specifically measures image sharpness at a pixel level.
Sharp images contain many abrupt transitions between neighboring pixels and therefore produce higher variance values. Blurred imagery smooths these transitions and lowers the variance significantly.
By combining entropy, edge density, and Variance of Laplacian into a single confidence score, the system would become more resilient to false positives caused by snow cover, cloud shadows, deserts, large water surfaces, or other naturally low-detail environments. The result would be a more robust indicator of intentional image degradation.
Cross-referencing multiple mapping providers
A second enhancement would be the ability to fetch and analyze imagery from multiple commercial mapping providers.
Instead of evaluating only Yandex imagery, the same workflow could retrieve equivalent map tiles from services such as Google Maps and Apple Maps. Comparing imagery from multiple providers would provide a valuable validation layer.
If an installation appears blurred on one platform but clearly visible on others, confidence increases that the blur is intentional rather than simply a result of poor image quality or outdated source data.
This cross-provider approach could also help identify inconsistencies in imagery age, resolution, or coverage. In some cases, the absence of visible blur may be just as interesting as its presence.
Monitoring updates using enterprise GEOINT platforms
Another natural evolution would be to move beyond public mapping services altogether and analyze continuously updated satellite imagery stored within a GEOINT platform such as T-Kartor Iris.
Rather than interrogating static map tiles, the workflow could operate directly against newly ingested satellite imagery from commercial satellite providers. Every new acquisition covering an area of interest could automatically be analyzed and compared against historical imagery.
Such a capability would transform the solution from a one-time investigative tool into a continuous monitoring capability.
Instead of asking:
“Is this location blurred today?”
The workflow could answer:
“Has anything changed since the previous acquisition?”
This opens the door to a much wider range of intelligence and monitoring applications.
Automated Battle Damage Assessment
Perhaps the most powerful future application is the automation of Battle Damage Assessment (BDA).
This concept follows a simple but potentially transformative workflow.
When a target is registered in a command-and-control, targeting, or mission-planning system, the workflow would automatically request the earliest available post-strike satellite imagery. Once the imagery becomes available, it would be compared against pre-strike imagery stored within the intelligence platform.
Rather than looking for blurred areas, the system would measure indicators of change, including:
- Structural damage
- Removal of buildings or infrastructure
- Crater formation
- Burn marks and debris fields
- Changes in vehicle concentrations
- Changes in activity patterns
The same underlying principles used for blur detection—measuring differences in image characteristics—could be expanded to quantify likely damage.
The output could be expressed as a confidence score such as:
- Minimal change detected
- Moderate change detected
- Significant structural change detected
- Severe destruction likely
Analysts would still perform the final assessment, but automation could dramatically reduce the time required to identify relevant imagery and prioritize locations requiring immediate review.
As the availability of commercial satellite imagery continues to increase, automated BDA has the potential to become a genuine force multiplier for intelligence organizations. Instead of waiting for analysts to manually compare imagery, the system could continuously monitor incoming imagery, identify likely changes, and immediately flag locations that warrant closer inspection.
In many ways, this represents the logical next step beyond blur detection. The challenge shifts from identifying deliberately hidden information to automatically detecting meaningful changes across massive volumes of imagery.
Looking beyond the blur
What began as an experiment in identifying potentially blurred military installations quickly highlights a broader reality: the value does not necessarily lie in the blur itself. The real value lies in continuously analyzing imagery, detecting anomalies, and guiding analysts toward locations that deserve attention.
Whether the objective is identifying intentionally obscured installations, validating imagery across multiple providers, monitoring newly acquired satellite data, or supporting battle damage assessment, the underlying principle remains the same:
Use automation to reduce the search space, allowing human analysts to focus their attention where it matters most.
In an era of abundant imagery and increasingly powerful AI-assisted analytics, that ability may ultimately prove more valuable than the imagery itself.
OSINT never sleeps
What makes this project interesting is not the image processing itself, but what it demonstrates about modern OSINT.
A relatively simple workflow can automatically:
- Fetch imagery from selected locations.
- Analyze image characteristics.
- Flag unusual changes.
- Prioritize locations for human review.
With some additional development, the system could run continuously, monitoring hundreds or thousands of known sites over time. Rather than manually inspecting imagery, analysts could be alerted when a location suddenly changes appearance, when new blurring appears, or when previously obscured imagery becomes visible.
This is ultimately the power of open-source intelligence. The challenge is no longer obtaining data. The challenge is filtering and prioritizing it.
When vast amounts of information are openly available, even something as simple as a blurry patch on a map can become a useful signal. And when those signals are monitored systematically, they can help direct attention to places that deserve a closer look.
In the end, OSINT is often less about discovering secrets and more about noticing patterns. Sometimes those patterns are hidden. Sometimes they are visible to everyone. And occasionally, they reveal themselves through an attempt to hide them.